Summary – A top-down review of interesting calls and comments made last week in Treasuries, monetary policy, economics, stocks, bonds & commodities. TACs is our acronym for Tweets, Articles, & Clips –our basic inputs for this article.
Editor’s Note: In this series of articles, we include important or interesting Tweets, Articles, Video Clips with our comments. This is an article that expresses our personal opinions about comments made on Television, Tweeter, and in Print. It is NOT intended to provide any investment advice of any type whatsoever. No one should base any investing decisions or conclusions based on anything written in or inferred from this article. Macro Viewpoints & its affiliates expressly disclaim all liability in respect to actions taken based on any or all of the information in this article. Investing is a serious matter and all investment decisions should only be taken after a detailed discussion with your investment advisor and should be subject to your objectives, suitability requirements and risk tolerance.
1. WOW
Last week we began with ” WOW – How else can you describe what they did to Amazon, Microsoft, Google, Domino’s Pizza on Thursday?” This week, we got a WOW in the other direction – How else can you describe what they did to Twitter, LinkedIn, Yahoo this week? These social networking stock are down 20%+ this week. Is that symmetry or does old beat new as the Boomers know so well.
2. U.S. Economy & Fed Meeting
Is the U.S. economy improving or faltering? We don’t have a clue unless some how employment is OK, income is higher, spending is improving but manufacturing, GDP etc. are crappy. Yes, Q1 GDP came in at 0.2% – #Fuggetaboutit. We all know it is history. But then the Atlanta Fed chimed in about Q2 on Friday with their forward looking forecast:
- “The GDPNow model forecast for real GDP growth (seasonally adjusted annual rate) in the second quarter of 2015 was 0.8 percent on May 1, down slightly from 0.9 percent on April 30. The nowcast for second-quarter real nonresidential structures investment growth fell to -20 percent following this morning’s construction spending report from the U.S. Census Bureau.” .

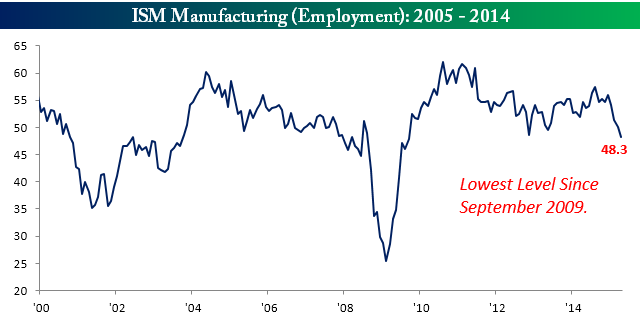
What about ISM?
- Bespoke @bespokeinvest – ISM Manufacturing’s current streak of 6 months without an increase is the longest in over a decade. https://www.bespokepremium.com/think-big-blog/its-a-start-ism-manufacturing-unchanged-in-april/ …
 Bespoke wrote:
- “the Employment component of this month’s report showed one of the largest declines relative to March and at a level of 48.3 is now at its lowest level since September 2009. Thankfully, manufacturing is a small share of the overall economy”
- David Rosenberg – Friday – A nice bounce in consumption spending to close Q1 – nominal persumption expenditure rose 0.4% MoM in March
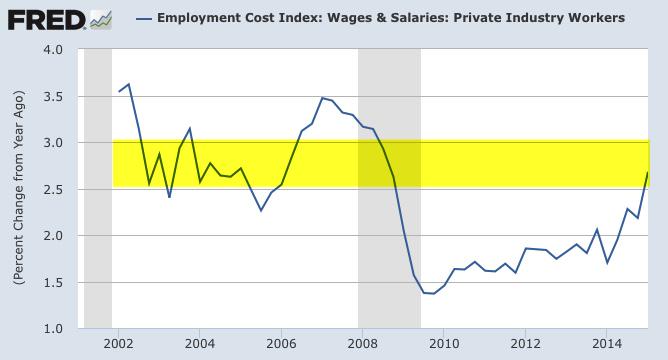
- Urban Carmel -@ukarlewitz – Best employment growth in more than 10 yrs and now the highest compensation growth in 8 yrs. Tailwind for consumption

- Kelly Evans @Kelly_Evans – There are “perceptions that credit isn’t available, but it really IS available now.” -Wells Fargo CEO John Stumpf @CNBC $WFC
- Eric Scott Hunsader @nanexllc – FOMC causes major currency reversal
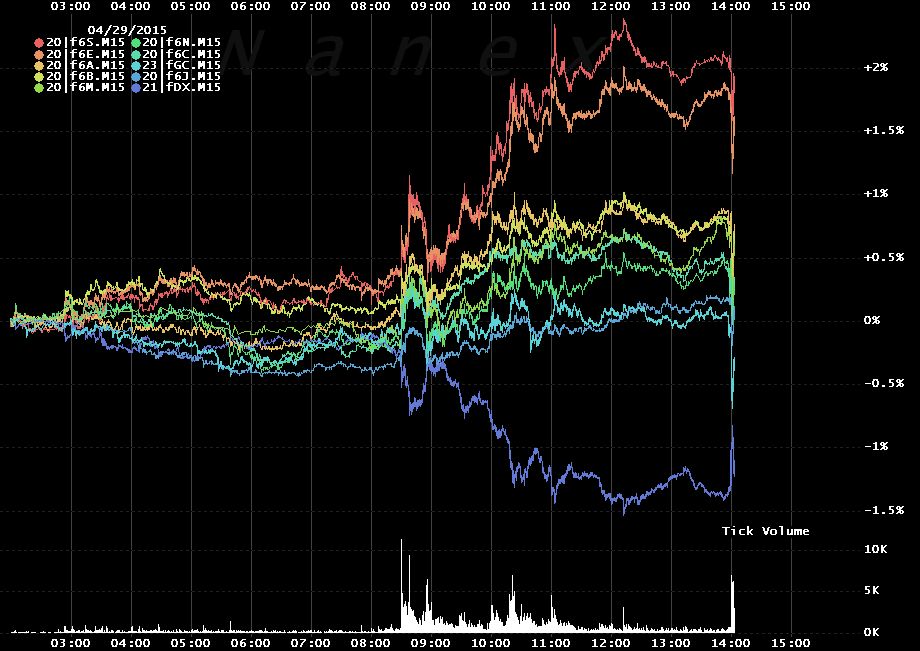
- “We know that FX traders are short euros and long dollars but it’s also a gigantic trade in bond markets. All the foreigners who front-ran ECB QE via German bonds are getting out of the trade. Because they hedged the FX side of the trade by selling euros and buying USD, they have to reverse the trade. By the same token, many Europeans may have bought Treasuries unhedged, expecting the euro to keep falling but they’re now feeling the FX squeeze. All evidence points to this as a pure euro short squeeze.”
A similar point was made on Thursday by:
- Lisa Abramowicz @LisaAbramowicz1 – “Market positioning on European bonds have reached levels so extreme that some people are getting out.” http://bloom.bg/1ETN4mt @business
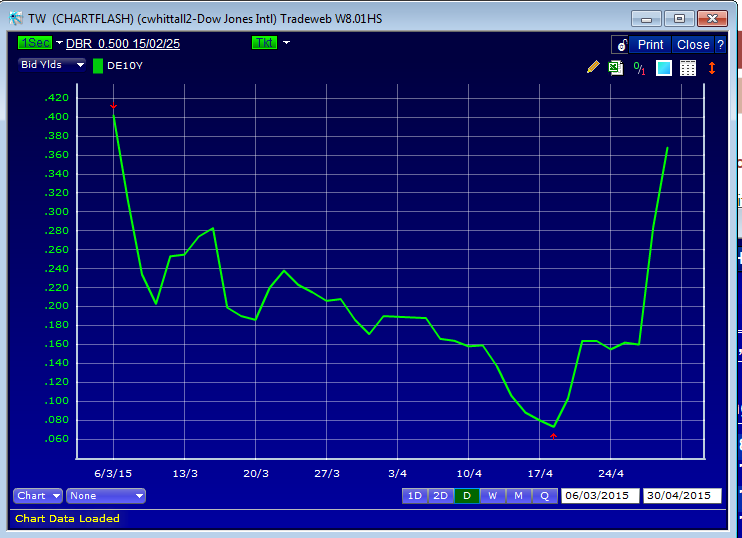
- Thursday – Chris Whittall @Chris_Whittall – Bund yields almost back at pre-Qe levels. Almost
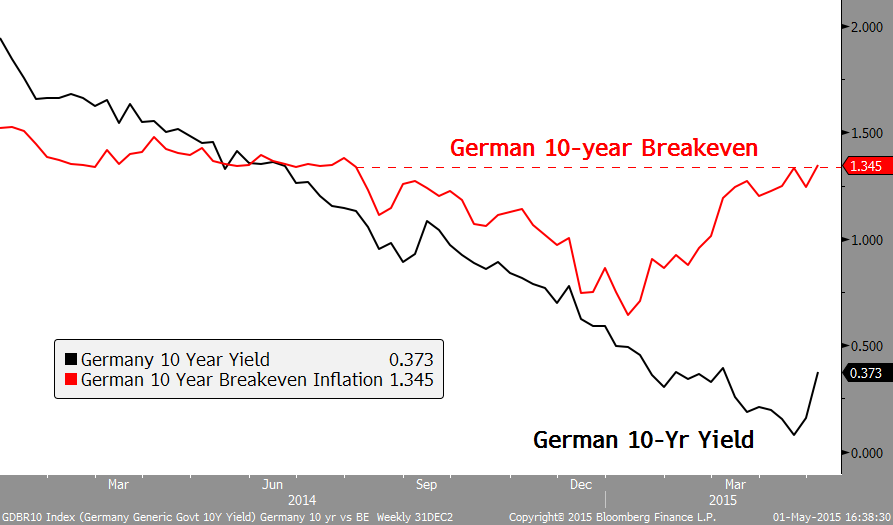
- Holger Zschaepitz @Schuldensuehner – Markets panicking after higher than expected German inflation

The DAX closed down 350+ points or 3% and all this was pre-Fed statement. The German yields rose a bit more on Thursday and did little on Friday to close the week at 82.5 bps & 35.7 bps, an increase of 25 bps & 20 bps for 30-yr & 10-yr yields resp. This better not have been about inflation because:
- Charlie Bilello, CMT @MktOutperform – In bond markets, big story was spike in Bund yields after Gundlach-Gross short comments. Still at -1% real yield.
- Dana Lyons – @JLyonsFundMGMT – (Post) UPDATE: Euro Facing First BIG Test In Its Bottoming Attempt – via @YahooFinance $FXE http://tmblr.co/Zyun3q1jjKyAs
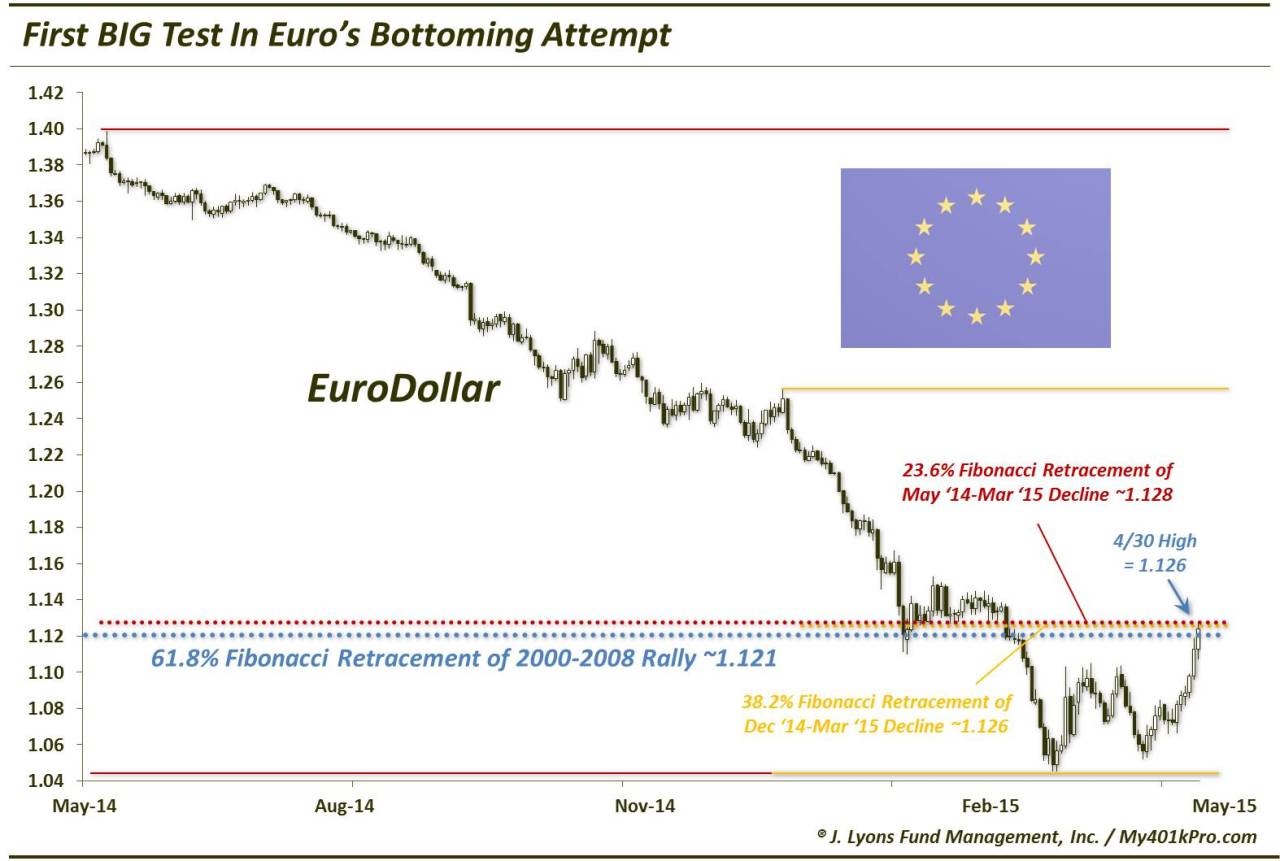 UPDATE: Euro Facing First BIG Test In Its Bottoming Attempt
- “The 1.12-1.13 area is THE big challenge that the Euro must overcome if we are to consider a potential long-term turn higher. Given the significance of the level, we do not expect it to give way easily – just as the Dollar rally will not easily die. … If and when the Euro is successful in overcoming the 1.12-1.13 level, in our view, a major longer-term turn higher could be in the works. And given the record shorts in the Euro still, a move above that level could see a rapid acceleration of the bounce, fueled by massive short-covering.”
- “We observe that the commercials have been adding to their long positioning in the 10-year for most of the year following a large reduction in net long contracts in January. Meanwhile in the 30-year, the commercials have flip flopped from being net short in November to net long today. Positioning for neither contract is at an extreme yet, but the move has been large enough for us to not rule out the possibility that rates go lower before to long.”
- “If you go back to last 8 times Fed raised interest rates or taking away stimulus via QE, takes us all the way back to the mid 80s, & thats the whole life of the junk bond market since the mid 80s, every single time, if you sold high yield bonds & bout Treasury bonds the day of the 1st Fed hike, you were able to buy them back cheaper relative to Treasuries during the hiking cycle – every single time.”
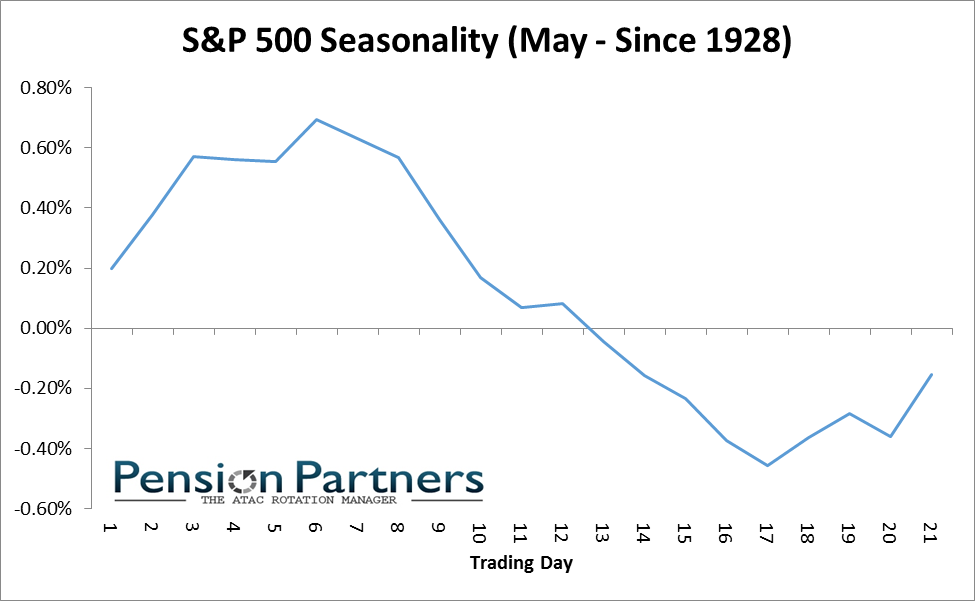
- Charlie Bilello, CMT @MktOutperform – Typical Typical May starts strong, begins to weaken after the 6th trading day. .
- Nautilus Research @NautilusCap – Flattish years in SP by end of April $SPY

- Dana Lyons – @JLyonsFundMGMT – (Post) A Few Twists To The “Sell In May” Phenomenon – via @YahooFinance $DIA http://tmblr.co/Zyun3q1jgdSNf
This is a detailed article that looks at May from two different angles. Read it to get the full value of the discussion.
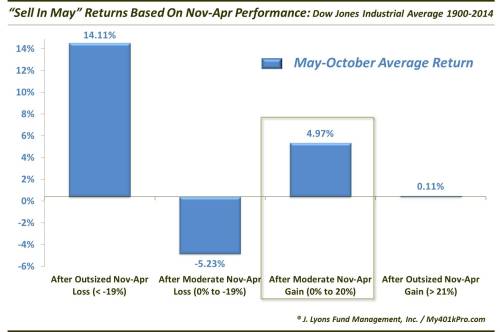
- “the “Sell In May And Go Away” adage should only be treated as a slight headwind for the market over the next 6 months. Although, given the returns following moderate gains over the preceding 6 months (as in our present situation) perhaps that slight headwind has been neutralized“
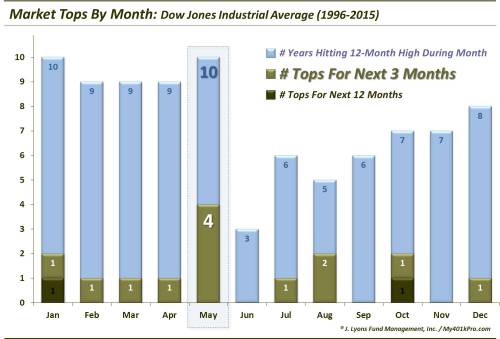
But what about the next 3 months? Dana Lyons answered that in his article May Has Become The (short-term) “Toppiest” Month.
- Northy – @NorthmanTrader – The $VIX musical chair range keeps getting small and smaller and smaller…

- Jason Goepfert @sentimentrader – Consistent half-hourly closes near the high is pushing the Oscillator close to its maximum

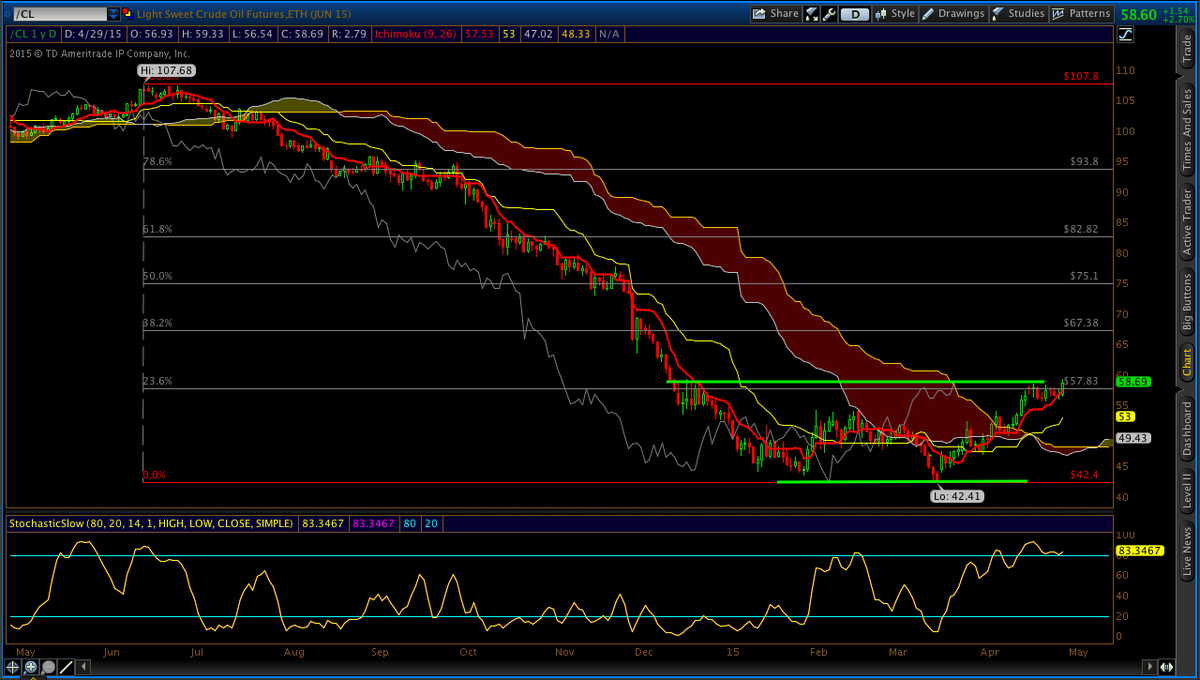
- “I am not negative but I am extremely cautious because I think oil was the last positive that we could have here – we cannot take rates any lower, & it is hard to imagine the chaos we see around the world is somehow gonna go away & give us another big lift“.
- Nautilus Research @NautilusCap – WTI Crude up 25% in a month $USO.

- Predicts $70 oil by year-end; Oil prices in $90-$100 within 12-18 months – Cushing changing from filling to drawing; high gasoline use & production rolling over; Eagleford/Bakken on decline because of shutting down of rigs; Permian will go next; You are now at record inventories; a year from now you are moving towards record low inventories; In December we had 1509 rigs on oil at that point; today you are 700; liitle less than 700;
- natural gas is oversupplied, oversupplied, oversupplied; its just cheap; nat gas will be >$3 in winter; there has been so much swtchint top nat gas at some point we weill see it;
A similar target was given by:
- Cousin_Vinny @Couzin_Vinny – $SPY bounce would be nice but $CL_F my biggest position for weeks http://stks.co/r1x73 38.2 target Shorterm 67.38
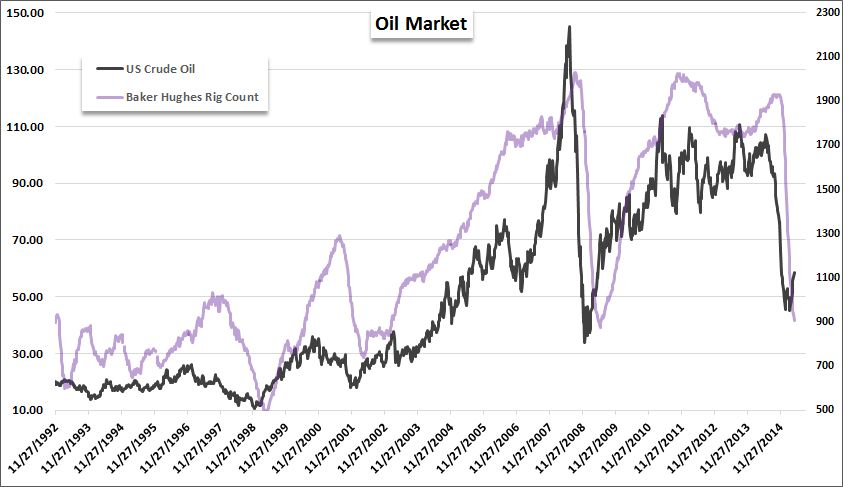
The bullishness case for Oil was summarized in Crude cuts keep coming: .
- “Even with the recent rebound in the price of crude oil, don’t look for production cuts to stop. Oil is breaking out as it is clear that crash in oil prices significantly changed the fundamentals and the future production growth curve. … Today, this will be expressed in part by the Baker Hughes U.S. rig count number. Last week the U.S. oil rig count falls for the 20th week in a row as the oil rig count dropped by 31 rigs. That is down to only 703 active rigs down from 1600.”
- “Oil is also getting support from wondering just what is going on in the Kingdom of Saudi Arabia. The Saudi Arabia’s Supreme Economic Council has approved a restructuring of Saudi Aramco that includes separating it from the oil ministry. The new Supreme Economic Council is a body formed by King Salman earlier this year to replace the Supreme Petroleum Council kicking out Saudi Oil minister Ali Naimi’s inner circle, which used to help set the kingdom’s oil policy. Naimi is getting isolated!”
Speaking of the Baker Hughes report,
- John Kicklighter @JohnKicklighter – The US oil and gas rig count from Baker Hughes down for a 21st week. Situation still looking like 2008
And speaking of Saudi Arabia,
- Javier Blas @JavierBlas2 – MUST READ: #SaudiArabia Is Burning Through its Petrodollar at a Record Pace #oil http://www.bloomberg.com/news/articles/2015-04-30/oil-plunge-royal-handouts-trigger-record-drop-in-saudi-reserves …

But what about natural gas?
- J.C. Parets @allstarcharts – I think NatGas gets > $3.30. Break of wedge. Target = former resistance & 38.2% Fib retracement of Q4-Q1
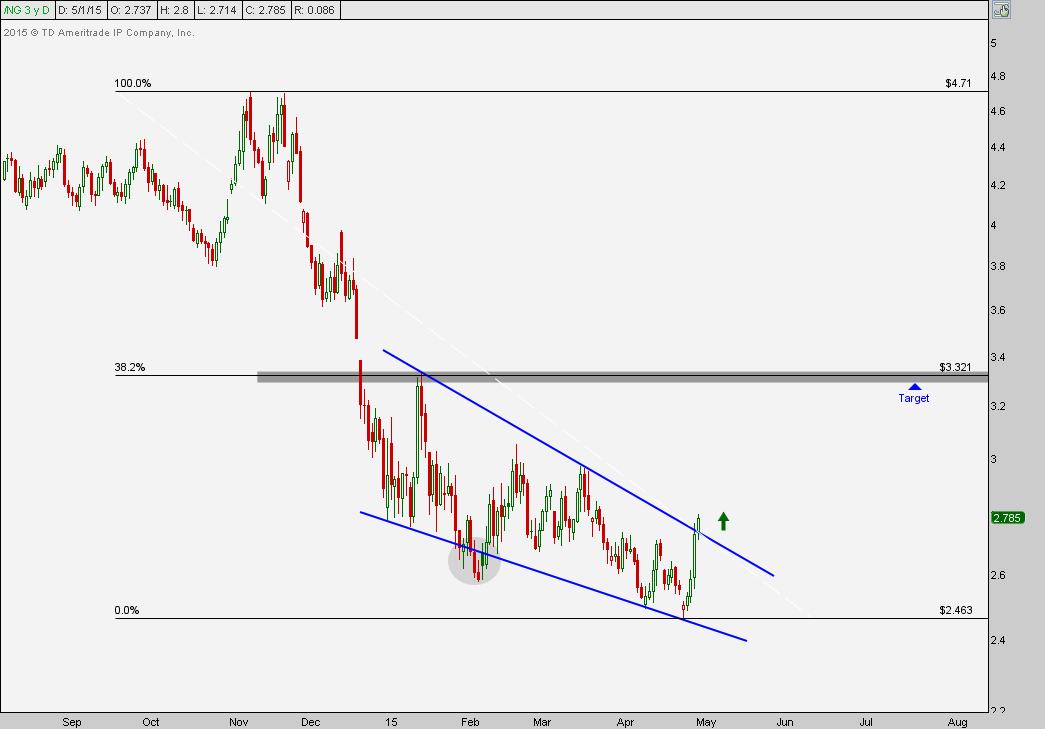
But a suggestion of caution:
- Andrew Thrasher, CMT @AndrewThrasher – @allstarcharts Momentum has gotten ahead of itself a little bit, I’d be surprised if we didn’t see a pullback of some sort. Interesting setup
Nothing acts as ugly as Gold. Dollar up, Dollar down, Gold just gets trashed. Is it about to be shot now?
- ForexLive @ForexLive – Why May will bring misery for gold bulls http://bit.ly/1PcIrU6
The worst sign for a market is when it can’t rally on good news. April was a dream month for the gold bulls.
- Soft economic news prompted much speculation about a later Fed hike
- The US dollar dove late in the month
- The ECB continued to print
- Commodities were broadly stronger
Even with all those tailwinds, gold couldn’t make any headway. Repeated tests of $1220 failed and after the Fed restated its optimistic outlook, gold prices took a $40 tumble. On Friday the April low of $1175 gave way in a quick move down to $1170. … That leave little support on the chart until the March low of $1144
May is the worst month for gold — on average — over the past decade. Prices average a 1.1% drop. The past four years have been especially dire, with prices averaging a 4.33% decline. … It’s not just may, the May-June period is the worst two month period on the calendar
All this technical & seasonal. What about a fundamental reason? The Oil Slump Is Emptying the Stores of Dubai, according to Bloomberg.

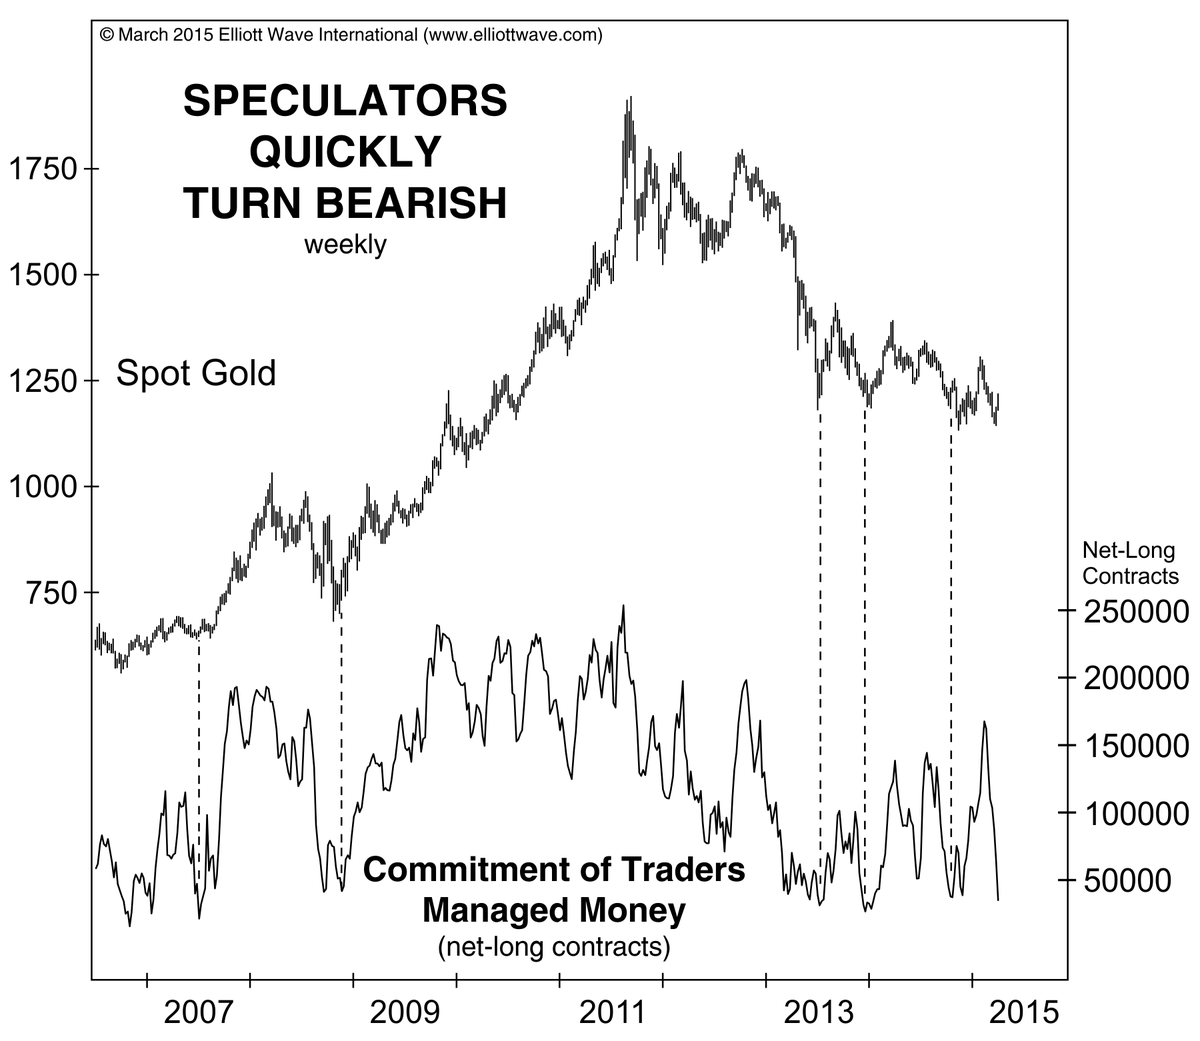
But is all this negativity a sign of a rally according to:
- Elliott Wave Int’l @elliottwaveintl – Gold’s price pattern & lopsided sentiment=clues well before the precious metal’s price rise… http://bit.ly/1JVk1wR
Given that Sunday is coming up:
- Interesting Laws ?@InterestingLaws – It is illegal for a man to scowl at his wife on Sunday. (Detroit, Michigan)
Send your feedback to [email protected] Or @MacroViewpoints on Twitter