Summary – A top-down review of interesting calls and comments made last week about monetary policy, economics, stocks, bonds & commodities. This week, we review the Federal Reserve meeting, Russia-Ukraine situation & the decline in the stock market. TACs is our acronym for Tweets, Articles, & Clips – our basic inputs for this article.
Editor’s Note: In this series of articles, we include important or interesting Tweets, Articles, Video Clips with our comments. This is an article that expresses our personal opinions about comments made on Television, Tweeter, and in Print. It is NOT intended to provide any investment advice of any type whatsoever. No one should base any investing decisions or conclusions based on anything written in or inferred from this article. Macro Viewpoints & its affiliates expressly disclaim all liability in respect to actions taken based on any or all of the information in this article. Investing is a serious matter and all investment decisions should only be taken after a detailed discussion with your investment advisor and should be subject to your objectives, suitability requirements and risk tolerance
1. Yellen-Fed, Putin-Ukraine, or Snowflake-Herd?
Thursday came seemingly out of the blue. What caused the 2% fall in major stock indices on Thursday? Was it the hawkish-sounding statement of the Fed on top of strong data? Or was it the fear of the impact of US sanctions on German, European companies, & more broadly on global trade? Had it been the latter, then Treasuries and Gold should have rallied on Thursday as stocks cratered. Had it been the Fed, then stocks should have rallied on Friday after the non-hot NFP number.
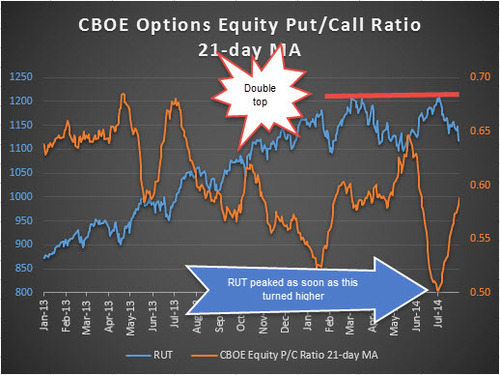
Perhaps, it was a classic stampede of a cattle herd on Thursday, as Mark Grant of Southwestern Securities put it on Friday morning on CNBC Squawk Box. Perhaps, it was that proverbial last straw on the camel’s back, what is described in Complexity Theory as the snowflake that finally causes the avalanche. The stock market system has been getting into a “critical state” for weeks, with divergences building, with Russell 2000 making a double top & giving way, with high-yield bonds getting sold off, with breadth deteriorating badly. The stage was set for a sharp fall and it happened on Thursday.
Is this decline the real thing, a serious correction? Or is it just a passing storm like many we have seen since August 2012? The first sign will be whether Friday’s deeply oversold condition of the S&P is a “good oversold” that leads to a meaningful bounce or a “bad oversold” which just gets worse.
2. Putin-Ukraine
This is definitely a major concern of the stock market. The rally in stocks off the bottom on Friday came as word of the Obama-Putin phone call came through. The Cognoscenti tweet-wrote their views on Friday:
- PIMCO @PIMCO – Gross: No country is an island. (Australia excepted). Global trade & growth will be affected by Russia/EU/U.S. trade war.
- Ralph Acampora CMT @Ralph_Acampora – The war in the Ukraine is causing both the DAX and the CAC 40 to break their respective 200 day- moving averages.
- MarketWatch – Germany’s DAX posts biggest weekly loss in two years as investors continued to worry about the fallout from the tougher sanctions on Russia
Some worried about much more than financial impact of sanctions:
- Friday – Lawrence McDonald @Convertbond – Putin’s Russia invaded Georgia in August 2008, hmmm.
This was a succinct summary of McDonald’s comments on CNBC Closing Bell on Thursday afternoon:
- “Putin is a 21st century Czar; we are hearing in the global news flow that head of German CIA said that his inner circle is crumbling right now; certain members that are putting pressure on him; we think that there is a higher probability a rising probability of a Putin aggressive move, an invasion, a deeper invasion action into the Ukraine; I think this will set up for a phenomenal buying opportunity ; you want to buy fear, there is not that much fear – right now I am moving to the sideline…”
When we have questions about Eastern Europe, we turn to a man who has forgotten more than we would ever know, George Friedman of Stratfor:
- “I would suspect that what Putin would want to do is change the psychology of the game where he is completely on the defensive. And try to demonstrate that he is still extremely dangerous, and for that his move is not going tobe sanctions or counter-sanctions. It would be a military move in the Donetsk area that is designed to really, really defeat Ukrainian forces in the east. To force the Americans to reconsider whether the Ukrainians are capable of dealing with the Russians. To force many of his rivals to really rethink whether he is finished.”
No wonder stocks rallied when news of a Obama-Putin jaw-jaw was released on Friday.
3. Yellen-Fed
We are simple folk and we think simply. When Chair Yellen sounds hawkish & economic data matches that hawkishness, the Treasury curve bear-flattens as it did on Wednesday. When the economic data matches her dovish nature, the Treasury curve bull-steepens as it did on Friday. When her tone & economic data suggests “steady as she goes”, the Treasury curve flattens steadily & gently. That has been the story of 2014.
The 3-year & 2-year yields closed at 1.02% & 56 bps post-Fed on Wednesday compared to 77 bps & 39 bps on December 31, 2013. In contrast, yields across the 30-5 year curve are well below their 12/31/2013 closing levels – with 30-yr yield down by 69 bps. This is the ytd reality despite all the Fed-head talk and expert opinions. This week’s reality is that the vertical rise in yields on Wednesday was nullified by a huge bull-steepening fall in yields on Friday. So this week might end up as just noise.
This is why we don’t really worry about which guru thinks the Fed was hawkish or which guru thinks the Fed was dovish. Gun to our head, we would say that the members of the FOMC are divided & confused about whether the economy will keep gaining strength or whether Q2 GDP might prove to be the peak for 2014. With multiple guns to our head, we would state our conviction that Chair Yellen is worried about her tightening actually causing a contraction in the economy and so she plans to keep rates at current levels until she is absolutely forced to raise them.
We really don’t know whether the 10-year will get to 2% as Mark Grant of Southwestern Securities said on Friday morning or end the year at 3% as Ira Harris of Credit Suisse said on Friday afternoon. So we let the Treasury market do price discovery for us, subject to Santelli’s 2.44%-2.66% range. .
- Thursday – J.C. Parets @allstarcharts – the $TLT filled that gap from 7/17 very nicely this morning and then took off. a close up here would be great
- Friday – Urban Carmel @ukarlewitz – ZB: 30 yr has held its breakout from a 10-week range. Long pierce pic.twitter.com/UW9mrYMmiN

4. High Yield
The biggest bullish factor for U.S. Treasuries is the ugly action in the High Yield bond market. .
- Thursday – Retweeted by Lisa Abramowicz MBT @TraderBoot $HYG chart looks disastrous…portend a correction on the way??? @Kathleen_Hays @carlquintanilla pic.twitter.com/4WgU3r63Cd

We get valuation correction but this ugliness is pointing to some ugly swampland in the economic landscape. The story is the same in European High yield credit:
- Friday – Charlie Bilello, CMT @MktOutperform – European credit spreads at a 5-month high. When negative rates are not enough…http://pensionpartners.com/blog/?=487 pic.twitter.com/BmpWCNDMkE

To those who think the action in High Yield & European High Yield is like 2008, Rich Bernstein said on Friday morning:
- Richard Bernstein @RBAdvisors – #Volatility returns. Keep the faith. Traditional bear market signs not evident. It’s not 2008 again.
5. Equities
On Monday, Ryan Detrick warned us in his article Here Comes August, Get Ready:
- “Lastly, we all remember how great last year was, but did you know that August was also one of just two months to see losses in 2013 (June being the other). In fact, it was the biggest monthly drop of the year at -3.13%. Not to mention it also had some huge drops in 2011 and 2010, this month is one to be wary of if you ask me. Here are all the recent returns.”
- “Do I think this bull market is still alive? Yes, absolutely. But you can’t argue with seasonality and that says be careful over the next two months.”
What did Detrick tweet-write on Friday?
- Friday – Ryan Detrick, CMT @RyanDetrick – New Post: One Chart That Scares Me Part 3 http://stks.co/g0tEl $SPY $IWM ==> Yeah, still scares me here via @YahooFinance.
(Ryan Detrick’s Tumblr – August 1, 2014)
His opinion –“I think it pays to be very open to further weakness the next few months”
Others seem to concur:
- Thursday – J.C. Parets @allstarcharts – nice candle in $SPX – looks like a solid breakdown. Likely to see plenty of follow thru in coming weeks. Very normal for this time of year.
- Friday afternoon – Trading Volatility @tradevolatility – Downside risks in $XIV & $SPX remain present. No need to try to catch a bottom here.
- Thursday – Chad Gassaway, CMT @WildcatTrader – If the SPX closes -1.4% or more for the first time in 20 sessions it has closed lower over the next 5 days 68.5% of the time (1990-Current).
- Friday – Ralph Acampora CMT @Ralph_Acampora Yesterday’s decline caused significant
technical damage across-the-board. Much of it is near-term but some of it is longer-term in
nature..
Lawrence McMillan turned negative with the break of his support levels:
- “The genie is now out of the bottle, and it’s going to be very hard to put him back in again. $SPX has broken major support at 1950, and that changes things: the chart of $SPX is no longer bullish; it is now bearish. As one might expect, volatility literally exploded yesterday. $VIX is now in an uptrend, and that is bearish for stocks. “
- “In summary, all of the indicators are negative. There are some oversold conditions beginning to appear, but there are no buy signals at this time.”
So how far could stocks fall? Mark Hulbert’s article says 20% based on simultaneous flashing of 3 signals:
- “The signals are excessive levels of bullish enthusiasm; significant overvaluation, based on measures like price/earnings ratios; and extreme divergences in the performances of different market sectors. … In fact, no bear market has occurred without these three signs flashing at the same time. Once they do, the average length of time to the beginning of a decline is about one month … “
Tom McClellan discusses a composite indicator he found recently and explains why he found it scary.
- “The magic of the composite indicator (ratio of Shiller’s CAPE & Moody’s BAA-yield) in this week’s chart is that by adjusting CAPE for the Moody’s Baa yield, the result seems to set a much more uniform ceiling for how high valuations can go. Getting above a certain level says that the market is really getting to the edge, and is near a MAJOR price top.”
- “this CAPE/Baa ratio is now up to the sort of level which has always marked a MAJOR stock market top every time it has been reached.”
- “Looking at past major tops, the final price top does not usually arrive while the CAPE/Baa ratio is in its steepest slope of an up move, like that which we are seeing right now.”
- “We also see that the price peaks in 1966 and 2000 came after this indicator had already peaked and turned down…. Today does not have to be the final moment for the long bull run, but it is the time to begin planning for the final moment“
It was hard to find a trader or guru who said buy stocks, except:
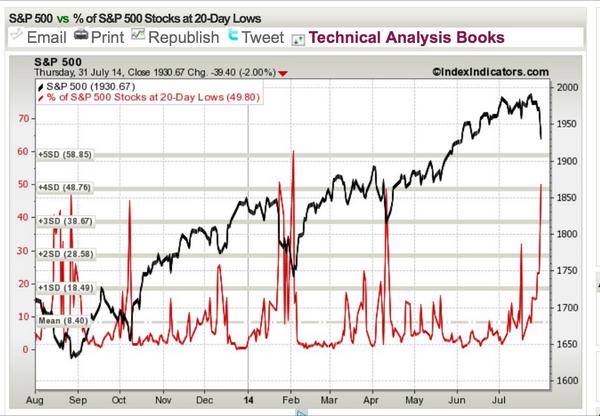
- Rachel @Sassy_SPY – Stocks at 20-day lows – get ready to buy $SPX SPY pic.twitter.com/lrc12H3ytR
Empirically speaking, when we find it hard to find/include a bullish stance, the stock market rallies the following week. Will this pattern hold next week?
6. Gold-Silver-Oil
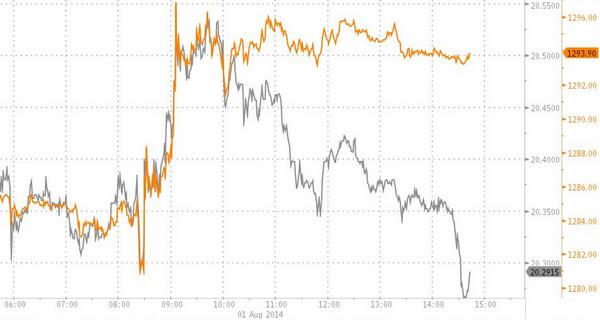
Both precious metals & Oil acted badly this week. Was it simply the strength in the U.S. Dollar? Silver acted really badly on Friday when compared to Gold:
- Friday – Tim Backshall @credittrader – Odd – Gold vs Silver today pic.twitter.com/Luzc5PqSLS
The recent rally in precious metals was led by Silver outperforming Gold. So is the above just a one-day aberration or a sign of faltering industrial demand? If the action in precious metals is mainly due to strength in the U.S. Dollar & if Paul Richards of UBS is right in saying Sell U.S. Dollar, then precious metals should do better. Will they?
Send your feedback to [email protected] Or @MacroViewpoints on Twitter