Summary – A top-down review of interesting calls and comments made last week about monetary policy, economics, stocks, bonds & commodities. This week, we review the volatility in the markets and the impact of Russia-Ukraine situation. TACs is our acronym for Tweets, Articles, & Clips – our basic inputs for this article.
Editor’s Note: In this series of articles, we include important or interesting Tweets, Articles, Video Clips with our comments. This is an article that expresses our personal opinions about comments made on Television, Tweeter, and in Print. It is NOT intended to provide any investment advice of any type whatsoever. No one should base any investing decisions or conclusions based on anything written in or inferred from this article. Macro Viewpoints & its affiliates expressly disclaim all liability in respect to actions taken based on any or all of the information in this article. Investing is a serious matter and all investment decisions should only be taken after a detailed discussion with your investment advisor and should be subject to your objectives, suitability requirements and risk tolerance
1. Who can doubt
that Ukraine-Russia rules the roost in global markets right now? In fact, you have to wonder whether Putin & Co are actually trading global markets as they send signals via tweets. Friday tells the tale – stocks were down overnight with Dow futures down 100 + points & the 10-year touching 2.34% (per Santelli); then came the early morning tweet from @RIA-Novosti saying “Russia is interested in peace in Ukraine and seeks to de-escalate conflict“. The Dow rallied in the morning hours & then sold off a bit. The worries about the weekend were just too much. That is why VIX remained near highs of the morning. Then just after 1 pm, came the news “Russia ends exercises“. And stocks exploded, VIX collapsed and long Treasuries reversed hard.
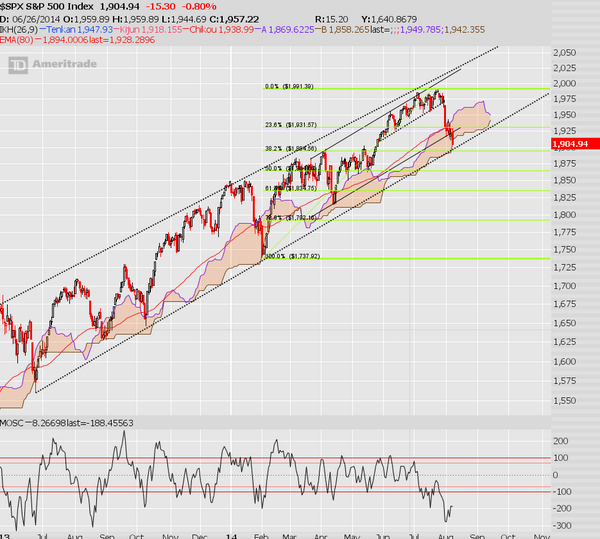
You can argue that the stage was set for Friday’s rally before the early morning tweet. As CNBC’s Brian Kelly pointed out, German DAX fell through 9,000 overnight and then recovered above that key level before the tweet. The stock markets were way oversold coming into Friday morning. And 1895 was a key level for the S&P as was pointed out on Thursday afternoon:
- Joe Kunkle @OptionsHawk – S&P coming in to trend support, also have 38.2% Fib. at 1895, and IchiMoku cloud been supportive on past dips pic.twitter.com/J3RkyeWWC7
 .
.
But it was some move on Friday:
- Lawrence McDonald @Convertbond – S&P 500 Futures low this morning of 1890 to 1930 this afternoon, 40 handle bounce
- Jeff Cooper @JeffCooperLive – I can’t help but be reminded of the Bernanke intervention on a Friday in August 2007 #squeezage
So far, the S&P has behaved like the other declines – breaking a key average like the 100-day and then reclaiming hallowed ground quickly and decisively.
- John Bollinger @bbands Crucial point: $SPX with 20-week Bollinger Bands. Support at the middle band is being tested. Held there on last five tests.
- Urban Carmel @ukarlewitz – SPY 15’ – top of pennant here. Active until broken either way. Into next week, volume pocket (yellow, look left) pic.twitter.com/MfOX7pCvtq
Will it hold again next week?
- Friday pre-open – Chad Gassaway, CMT @WildcatTrader – We are nearing a period of seasonal strength in the SPX. Historically rallies from the 8th session through the 17th.
Apparently, the picture reportedly changes the week after:
- Chad Gassaway, CMT @WildcatTrader – 9 of 12 times we have had two consecutive weeks lower since 2012 a new low has been put in over the next two weeks.
- Urban Carmel @ukarlewitz – @WildcatTrader even more true when the 2 down starts from a relative high as opposed to at the end of succession of lows
This sort of dovetails with an analysis that doesn’t need Russia-Ukraine. Tom McClellan writes in his Presidential Cycle of 2nd Term Presidents article:
- “… the steep drop which began from the July 24 top is happening pretty much on schedule. A brief pause in the decline is due over the next few days, and then a resumption of the decline should appear. The ideal bottom equates to around Sep. 10, although the bottom to go up out of does not appear until a month later.”
Which markets have been hurt the most in the correction? GaveKal answered in their Four Simple Charts … article on Friday:
- “The corrective phase has taken root primarily in Europe and least so in Asia. North America is somewhere in the middle. In Europe, the percent of stocks that are either in a correction or a bear market (buckets 2-4) represent 68% of the total, so we know that the selloff in Europe has been widespread. In North America and Asia the percent of stocks in a correction or a bear market is only 35%.”
Those which decline the least during a correction bounce first & hardest in the post-correction rally, goes an old tenet. But is the correction over? Putin is probably the best judge of that.
2. Treasury Market
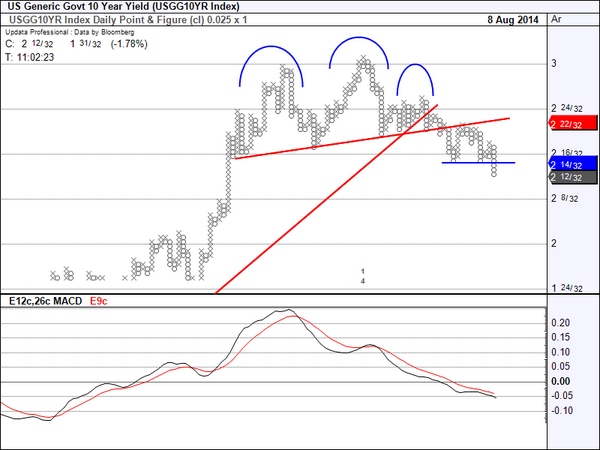
This has been a good week for the Treasury market with the 10-year yield falling almost 8 basis points to close at 2.42%. Yields began falling hard on Thursday (with entire 30-5 year curve falling by 5-6 bps in yield) and suffered a meltdown of sorts overnight. Despite the reversal on Friday afternoon (with stocks exploding & VIX collapsing), the 10-year yield closed the week down 8 bps at 2.42%, a weekly close below prior 2014 low closing yield of 2.44%. Yields across the rest of the curve closed down 4-5 bps on the week.
What struck us on Thursday was the overwhelming outpouring of sentiment from traders and gurus:
- Sri Kumar on CNBC Street Signs on Thursday – 10-year yield will drop below 2% within 6 months
- Thursday – Bespoke ?@bespokeinvest If 10-year yield breaks 2.4%, not much support until all the way down at 2.1%..
- Thursday – Tom Graff ?@tdgraff – Thus ends my rudimentary read of Tsy market technicals. Think we are vulnerable for panic buying if 10s breech 2.40%. @ByrneRWS @hmeisler
- Thursday – Tom Graff ?@tdgraff – This marks the 3rd test of 2.44% for 10yr since May. Looking back from ’13, obvious gap between 2.20% and 2.40%. pic.twitter.com/IF9tvd6lMP
- Thursday – Tom Graff @tdgraff 30-year yields… Looks like perhaps the old trend channel is now forming a resistance point. pic.twitter.com/fP9Ww8NvZD
This continued Friday morning:
- Rick Santelli on Santelli Exchange – filling the gap would lead to 2.25% on the 10-year yield … can we see 2% on the 10-year yield? I am in that camp.
- Retweeted by J.C. Parets – Bruce Kamich @BruceKamich Lower yields lie ahead – 2% or even 1.80% look possible for the US 10-year treasury. Buy bonds or go long the TLT etf pic.twitter.com/usp8L3g062
Then Jim Bianco came on CNBC’s Santelli Exchange on Friday morning:
- “everybody is bearish on interest rates now even though we are under 2.40%; everybody is looking for rising rates – it happened last year; they are predicting what happened last year”
Hmm, we said because Bianco has jinxed the Treasury rally before. Remember what he said on May 14 on CNBC Closing Bell?
- “I think that this capitulation trade we’re going to see now is a lot larger than people think – yields can fall a lot more before this is over with”
Yields did fall more until the end of May and then rose steadily to 2.65% on June 17. This time, his jinx acted in two hours. Treasuries market reversed swiftly and decisively after the news of end of Russia’s exercise. TLT had reached a new 18-month high of $116.42 on Friday morning (so said CNBC’s Guy Adami) and closed down on the day. Clearly Mr. Bianco and his comments are not responsible for Friday afternoon’s reversal. But then a jinx is essentially a superstitious curse, isn’t it? Sorry Jim, but little less hubris would help.
Next week should be a key week with 3-10-30 year auctions. Bulls would not want to see a weekly reversal of this week’s break of 2.44%. The most interesting comment in favor of long maturity treasuries came on Thursday:
- BlackRock® @blackrock – Rick Rieder: Jobless claims surprise raises odds of early 2015 rate hike, a reason to prefer longer-dated Treasuries over 2-5 year durations .
And then you have the 10-yr German Bund closing the week at 1.05% & the 10-year JGB at 51bps; Shouldn’t the 10-year UST at least get to 2.25%, if not 2%?
3. HighYield
Money seems to be rushing out of high yield faster than a speeding bullet. This week was the 4th largest week of HY bond outflows as % AUM ever. Then why isn’t that market melting down?
- Friday – Lisa Abramowicz @LisaAbramowicz1 Here’s why junk debt hasn’t sold off more given a $7.1 bln outflow: fund managers are using cash to meet redemptions. http://bloom.bg/1uvQ2nU
Some suggest that this oversold market might rally:
- Cousin_Vinny @Couzin_Vinny – $HYG and $JNK signaled the top – bounce? Green lights starting to light up. $TICK still ambivalent http://stks.co/d0s0Z .
4. Equities
Friday did lead to an up week in most indices. Small caps acted best with RUT up 1.4%; other broad indices were up about 37 bps with Transports down 36 bps. What did our gurus say?
Marc Faber spoke like the veteran he is on BTV Street Smart on Thursday:
- “markets were incredibly overbought as of 3-4 weeks ago & this decline is a normal reaction to a very overbought very optimistic in investors… we will have to wait now for a rebound and the rebound will tell us whether the recent highs are highs for the year or whether we can make new highs … this is not known yet…
- Ukraine – if there is no solution, then it is very negative for world trade, very negative for export industries in Europe, & it is also very negative for Russia – all are losers – but the problem is a wider problem
- we have had a colossal asset inflation – everything has gone up … between now & year-end market will drop something like another 10% or even 20% ; I think we can have a big sell off in the fall
Many have written about Presidential Cycles and stock market. This week, Tom McClellan argues that 2nd year of a 2nd term President is different:
- ... the 2nd year is almost the exact opposite with a 2nd term president in office like we have now. The market typically reaches a peak in July (not in May, as so many believe), and then drops for the rest of the summer toward a September low.
- It quickly becomes obvious that the current market action is behaving a whole lot more like the average pattern for 2nd term presidents, which is as one would expect. The magnitude of the movements has been greater than average, which is also normal, and not all that remarkable.
- It shows that the steep drop which began from the July 24 top is happening pretty much on schedule. A brief pause in the decline is due over the next few days, and then a resumption of the decline should appear. The ideal bottom equates to around Sep. 10, although the bottom to go up out of does not appear until a month later.
The most bullish strategist of all (2185 S&P at year end), Tony Dwyer, was consistent in his comments on CNBC FM 1/2 on Wednesday:
- “market is already in correction; at the end everything gets hit as it did in January; we are about 1/2 way through in price correction & there in timing correction is here”
- “if your view is beyond 6 months, buy whatever happens next week, next month; it doesn’t matter; but if you have a 3-week view, then wait because we will be 3% lower“
Some technicians saw a continuation of current pattern, others see a change:
- Thursday Mark Newton ?@MarkNewtonCMT Key to note that this move to new lows coming on Far BETTER breadth- ONLY 3/2 negative, than last week’s 12-1
- Thursday – J.C. Parets ?@allstarcharts here’s your stock market now rolling over to catch up with what the bond market has already been telling us $SPY $TLT pic.twitter.com/kYdwG7gqt1

5. Commodities
A number of technicians commented on commodities on Thursday beginning with
- Thursday Andrew Thrasher, CMT ?@AndrewThrasher – Cotton prices have fallen 30% but has it bottomed? I look at price action, seasonality, & COT data here: http://stks.co/c0rjk $BAL $$
The link is to the article by Thrasher titled Are Cotton Prices Finding A Bottom?
- … I think Cotton prices may be ready to start putting in a bottom. … The iPath Cotton ETF (BAL) has fallen 30% from its 2014 high as it drops down to its prior 2012 low at $42. Cotton prices fell nearly 60% from the 2011 high before putting in a bottom in 2012. This creates a large channel if we see prices rise from here. If price were to break out, the move could be fairly large coming off of a multi-year congestion period.
Then came a broader call:
- Thursday – Mark Newton ?@MarkNewtonCMT – Signs that Commodities are beginning to bottom out are interesting, looking at $NG, $RBOB, $CL,$SB http://stks.co/a0rQI

We continue to be frustrated by the action of Gold. So what do you think of Gold, Mr. Newton?
- Thursday – Mark Newton ?@MarkNewtonCMT – Like today’s move in Gold, & Think precious metals start to work after recent stallout as well http://stks.co/b0rPy

What about from a longer perspective?
- Thursday Mark Newton ?@MarkNewtonCMT – Larger $GC_F chart puts today’s move in perspective- Attractive Technical risk/reward in my view http://stks.co/s0dVE

And then you have:
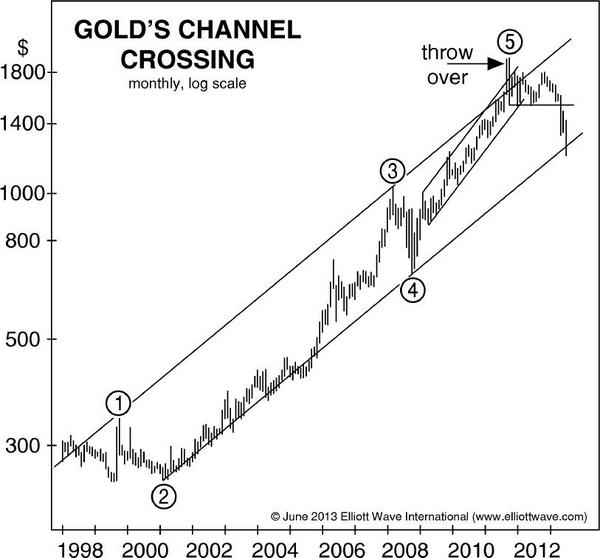
- Thursday – Elliott Wave Int’l ?@elliottwaveintl – Fundamentals seem to offer reasons to own gold…Instead, keep an eye on its wave structure: http://bit.ly/1AXNEuN pic.twitter.com/xia5n8GaGp
6. Words from the Wise
First Raghuram Rajan, the well known Governor of the Reserve Bank of India – from his interview with Central Banking Journal & via WSJ:
- “… the global economy bears an increasing resemblance to its condition in the 1930s, with advanced economies trying to pull out of the Great Recession at each other’s expense.”
- “The difference: competitive monetary policy easing has now taken the place of competitive currency devaluations as the favored tool for playing a zero-sum game that is bound to end in disaster. Now, as then, “demand shifting” has taken the place of “demand creation,””
- “We are taking a greater chance of having another crash at a time when the world is less capable of bearing the cost,”
- “A clear symptom of the major imbalances crippling the world’s financial market is the over valuation of the euro – the exchange rate is too strong given the euro area’s economic standing”
- ” … economists still disregard the central role of financial systems in the economy and believe they can predict upcoming disruptions. … They still do not pay enough attention–en passant–to the financial sector, … Financial sector crises are not as predictable. The risks build up until, wham, it hits you.”
and now, Jeffrey Gundlach on FT via CNBC:
- 2020 – a wall of high-yield debt that companies will need to refinance; soaring federal government deficits as baby-boomers drain social security and healthcare funds; ageing populations in China and other emerging markets; and the Federal Reserve’s Treasury holdings maturing, too. … It seems like one of the consequences of this zero interest rate policy is you’ve pushed out the problem of refinancing, of rolling over, but you’ve really compounded the magnitude of it and it seems to be focused around the 2020
- His conclusion? By 2020, the Fed may well be resurrecting quantitative easing, its palliative for troubled markets.
- Growth – “I would still be surprised to see full-year 2014 GDP exceed 2 per cent.”
7. What does this say?
The virtue & necessity of patience, says the Guardian.

An elephant scratches an itch on a car in the Pilanesberg National Park, South Africa. The occupants of the car waited patiently inside for the elephant to finish its business. Photograph: Armand Grobler/Barcroft Media
Send your feedback to [email protected] Or @MacroViewpoints on Twitter