Editor’s Note: In this series of articles, we include important or interesting tweets, articles, videoclips with our comments. This is an article that expresses our personal opinions about comments made on Television, Tweeter, and in Print. It is NOT intended to provide any investment advice of any type whatsoever. No one should base any investing decisions or conclusions based on anything written in or inferred from this article. Macro Viewpoints & its affiliates expressly disclaim all liability in respect to actions taken based on any or all of the information in this article. Investing is a serious matter and all investment decisions should only be taken after a detailed discussion with your investment advisor and should be subject to your objectives, suitability requirements and risk tolerance
1. Calls that worked this week
Calls that work quickly are generally rare. We were struck by two that worked this week. One that worked very quickly is
- Monday – J.C. Parets @allstarcharts – here’s the chart. Is the S&P500 a fade up here for a trade? Nice risk/reward pic.twitter.com/Gc6pQH7MT8
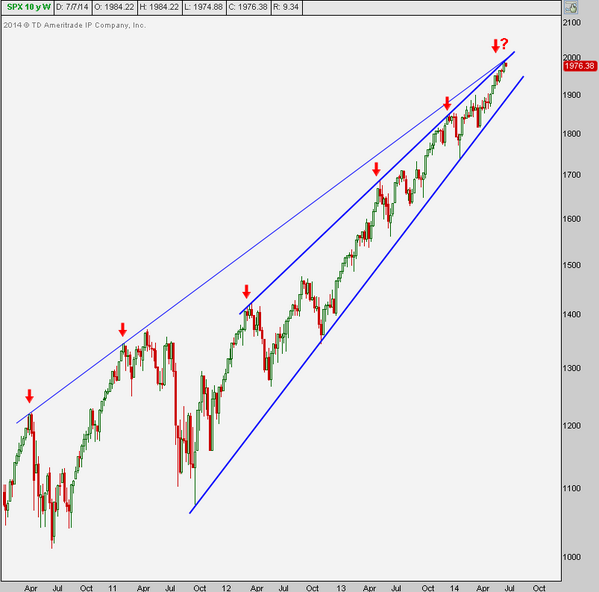
That certainly made money. Perhaps one reason fading S&P this week made money is the warning given two weeks ago proved prescient. We refer to the tweet below:
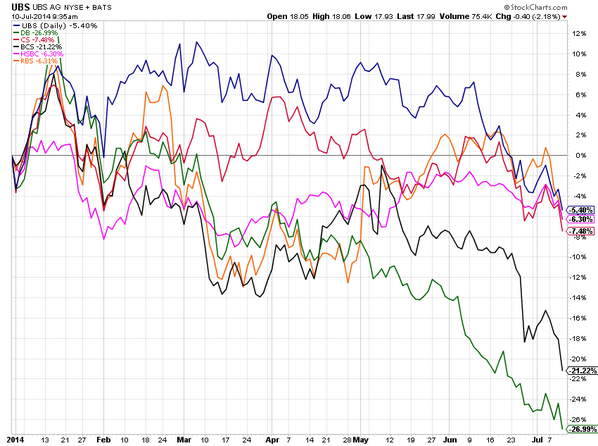
- Thursday, June 26 – Charlie Bilello, CMT @MktOutperform – These European banks continue to weaken. Nobody talking about it yet but suspect it will become an issue soon.
It became the issue du jour this Thursday with the downgrade of Portugal’s Bano Espirito Santo. Mr. Bilello took a victory lap on Thursday:
- Charlie Bilello, CMT @MktOutperform – Been focusing on European bank weakness over the past two weeks. Now the market cares. New YTD lows across the board. pic.twitter.com/eRWugE2SUd
We have seen similar calls fail to work this year. But this week seemed different. Seasonality?
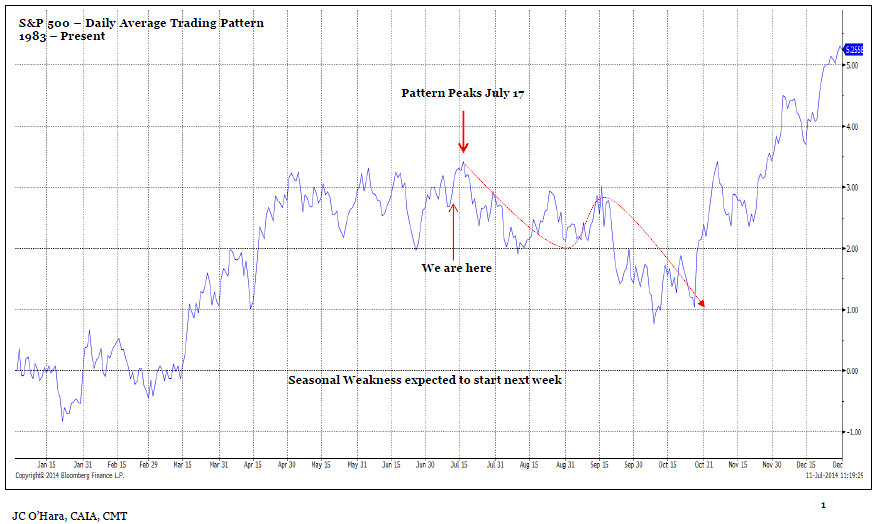
- Friday – J.C. Parets @allstarcharts – Here is the S&P500 seasonal chart since 1983. The pattern peaks next week $SPY
2. Fed Minutes
The one big up day this week was on Wednesday, the day Fed minutes were released. The minutes told us that the Fed plans to complete their taper in October but rates will remain where they are. Predictably, stocks, treasuries & gold-silver rallied. But the big winners were gold miner ETFs – GDX & GDXJ closed up 2.61% & 5.52% on Wednesday.
But Larry McDonald was not happy. Read what he said on CNBC Closing Bell on Wednesday afternoon:
- “I think after Lehman and everything we’ve been through since the last five, six years, I think Ms. Yellen’s comments last week were pretty irresponsible. talking about seeing asset bubbles shouldn’t have any impact on fed policy. And I think that’s the wrong approach. It’s a really dovish statement but just sets it up for another potential problem.”
Veteran hedge fund manager David Gerstenhaber was not worried about a credit problem. His main worry is loss of Fed’s credibility as he told CNBC Squawk Box on Friday:
- “The Federal Reserve is risking its credibility among investors by refusing to consider a sooner interest rate hike … The real question is whether the Fed changes its tune in September, .. if we see the economy continuing to move ahead at a reasonable clip, the monetary policies settings on a forward basis are inappropriate …”
But is the Fed deliberately “risking credibility” as Gerstenhaber put it? David Rosenberg of Gluskin Sheff put it differently on Monday on CNBC SOTS:
- “I think that they are deliberately going to be late in terms of inflation this cycle. they’ve already told us that 2% is no longer a ceiling, 2% on inflation is a floor. … when you look at what’s happening in the commodity markets now and look at how inflation is spreading through the service sector, whether you want to look at the PC deflator or core service segment of the cpi, inflation, pressures, although they are low, are intensifying and spreading out. This is a Fed that is bent on trying to create a moderately higher inflationary environment, & I think the big risk going forward is that they could end up getting more than they think they are going to get at the outset.”
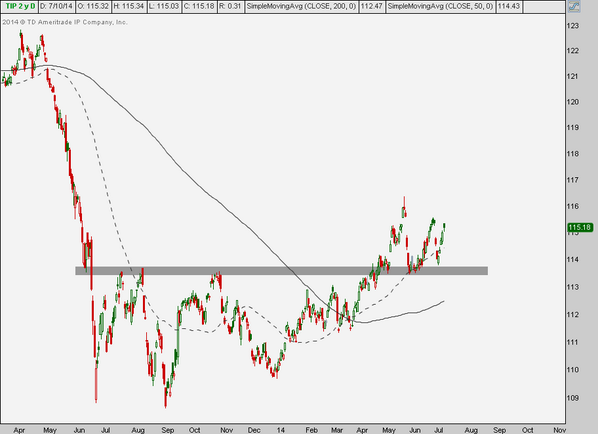
Well, if inflation is on its way, shouldn’t you be thinking about TIPS? That is what Pimco is suggesting and that is what was suggested in the tweet below:
- Thursday – J.C. Parets @allstarcharts – Look at Inflation-Protected Treasuries finding support at former resistance and now off to the races $TIPS
These are all smart folks. In contrast, we are quite simple. From what we have seen, the moment the Fed hints about bringing forward its timetable for raising rates, the 30-5 year yield curve flattens. That is what happened after Dr. Yellen’s comments on March 19 and after the 288,000 jobs number last Thursday. This is weird because the 30-year bond is the security most vulnerable to inflation and as David Rosenberg argued on Monday:
- “I actually think they are going to probably end up raising rates, i think by early next year, Sara. … if the employment rate by the end of the year is firmly below 6%, the way it’s going it could be closer to 5.5%. you’re going to have probably look at the momentum in underlying inflation, we could have core inflation easily at 2.5% by the end of the year. unemployment through 6%. the question would be for any dove, how can you really justify zero percent policy rates in that sort of an environment. it cannot be justifiable – my sense is at that point with the taper done,the bond vigilantes may finally start to come out. they’ve been in hiding but it could be that the bond market pushes the Fed ahead of schedule.”
But what if the long end of treasury curve is suggesting the reverse – that rate hikes by the Fed will actually end up slowing the U.S. economy & that inflation Rosenberg sees might actually be a short term spike? We think Dr. Yellen is thoroughly aware of the message of a flattish or inverted yield curve and she will not, in our opinion, raise rates as long as the long duration yields remain dormant. But if David Rosenberg is correct and if the bond vigilantes force short maturity yields to rise to flatten the curve, then Dr. Yellen may get what she dreads most whether she raises rates or not.
Or the long end of the curve may be smelling what Tom McClellan argued on Friday in his Inflation Arriving For A Short Stay article:
- “What this model shows for the immediate future is a continued rise for CPI inflation into the end of 2014, which will probably get Wall Street worrying about the specter of looming “hyper-inflation” and other concerns. But then 2015-2016 should see gradually declining inflation rates as the echo of warming years in 2012-13″
Does Dr. Yellen see a similar risk? Is she concerned that if she raises rates in early 2015 then she might be tightening into a period of declining inflation and thereby actually create a slowdown in the economy? That is what the Fed did in early-mid 2008 creating a problem that led to the rant of Jim Cramer in July 2008. Dr. Yellen lived through that period and, we think, she is aware how bad a wrong tightening could be for the economy and credit markets. As we recall, the long end of the Treasury curve began sending its message in July 2007. Bernanke did not get that message and so Cramer ended up screaming in July 2008 that “… he has no idea how bad it is out there… “
We may be fanciful, wrong, and/or dumb here. But the yield curve spread touching its 2009 low with long yields moving lower is not to be taken lightly.
3. Bonds
Treasuries had a good week across the curve – 30-yr yield fell by 13 bps, 10-yr by 12 bps & 5-yr by 10 bps. This was despite auctions that were ho-hum at best. TLT rallied by 2.6% and EDV, the zero-coupon ETF, rallied by 3.5%. What’s next?
David Gerstenhaber was clear in his conversation on CNBC Squawk Box on Friday:
- “they’ve been lucky with Bonds. Bonds don’t represent good value but German Bunds are yielding down 1.2%; German Bunds is generating attraction to U.S. bonds which act better than they should I think… I wouldn’t be buying them.”
On the other hand, ElliottWave-Forecast,com wrote:
- Preferred Elliott wave view is that dip to 2.402% completed wave ( W ) and recovery to 2.692% was a corrective wave ( X ). Decline from 2.692% high is so far in 5 swings and while below 2.601% high, we expect to see 1 more push lower toward 2.433 – 2.465% area to complete 7 swing structure (labelled A). After that yields should bounce and correct the drop from 2.692% high, this bounce can take us to 50- 61.8 fib zone of the drop from 2.692% before the decline resumes. We don’t like buying into proposed wave B bounce as we expect it to fail for 1 more push lower.
We remind readers that 2.44% – 2.66% is Rick Santelli’s range and his stand is that break in either direction would be important.
A simple comment came from:
- Tuesday – Keith McCullough @KeithMcCullough – 83% of the long end of the curve (bond yield) can be explained by the slope of US growth.
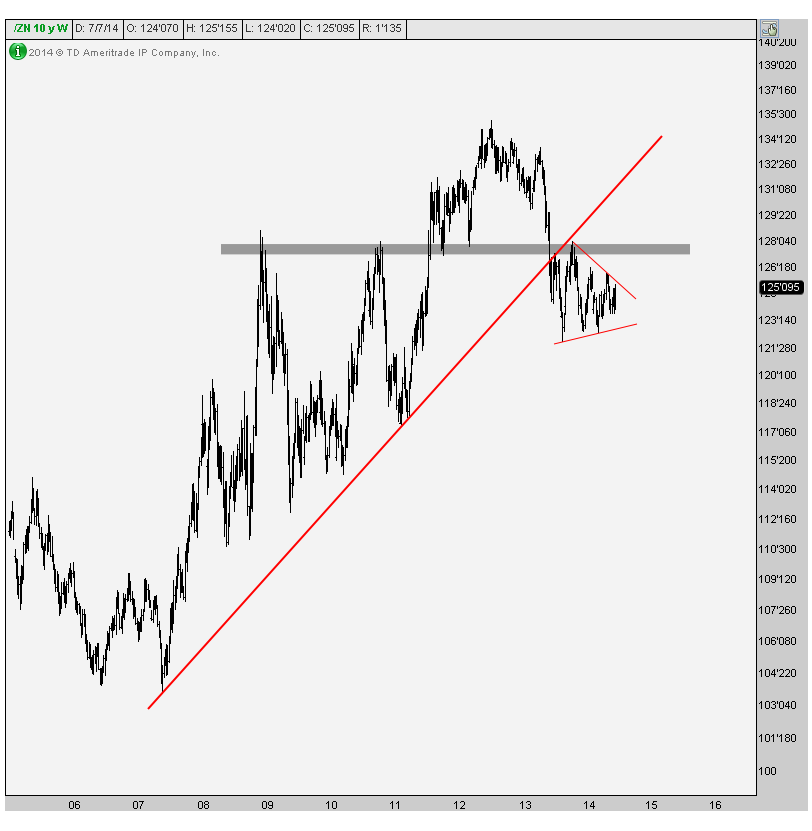
A two-sided argument came from J.C. Parets in What Do You Think About Bonds?
- Forgetting everything I think, this looks to me like a nice little symmetrical triangle below broken support. The likelihood here is that the bigger trend continues lower. But looking at other bond metrics, interest rates, yield curves, sentiment, seasonality and other intermarket relationships, I have to lean on the weight-of-the-evidence which still suggests higher bond prices and lower interest rates. This chart, however, keeps me on my toes and helps me avoid complacency. … But as far as treasury bonds go, despite the chart above, I have to stick with the bulls. At least for now.
The above comments refers to his chart below.
.
4. Equities
The U.S. equity market had a so-so week. Despite the sharp rise in volatility, the S&P did not even decline by 1%. The Russell 2000 however fell by 4% on the week. Can S&P advance while Russell 2000 declines? One said No:
- Charlie Bilello, CMT @MktOutperform – In Mar/Apr saw $RUT decline and $SPX advance for first time in history. $RUT weakening again here, repeat not likely. pic.twitter.com/ujgiVXO4tZ.

Mary Ann Bartels of BAC-Merrill Lynch on CNBC SOTS on Monday, July 7:
- “you’re starting to see some of the shorts cover but not that much. we still see fund managers sitting on cash. I think you have to get everybody in. I still think the fireworks continue through the summer. but maybe a little bit more cautious as we go into the fall. we really believe we’re in a new secular bull market. that means we’re out of the trading range. we’re in an uptrend. when you study all of the secular bear markets that were in trading ranges, they all have to get tested. you normally get a 20 or 30% test then go on to new highs. we see the market rising over the next decade, but you’re going to get bear markets but right now we don’t have any signals either technically or fundamentally that you’re about to enter a bear market.”
David Gerstenhaber is bullish for this year with year-end S&P target of 2,000 and bullish for 2015 as well as he told CNBC Squawk Box on Friday:
- “I think any pullbacks are going to be quite limited at this stage of the game. we have an economy that’s expanding again at a reasonable clip. the first quarter was an aberration. the second quarter things are coming back. third quarter seems to be off to a decent start. I’m not sure what the argument for meaningful pullback is at this point in time. I think as long as earnings move up at a real pace we ought to make gains in equities next year. The conditions that end a bull market, which is the Fed tightening an economy that’s overheating aren’t in place at this stage of the game.”
But smart & successful private equity players think differently. Wilbur Ross told CNBC Squawk Box that he is “selling 6 times the amount he is buying“.
Laszlo Birinyi is still bullish with year-end S&P target of 2,100 but suggested trimming fat on CNBC FM – 1/2 on Monday, July 7:
- “There are no bargains right now. There are no good deals. It’s like 3 p.m. on Black Friday at Wal-Mart, … But there are opportunities that will present themselves. For example, airlines were down on Wednesday so we bought some. Corrections are a function of events. Corrections are a function of downgrading of U.S. debt, Russian debt crisis, long-term capital. They’re not organic, and so therefore you cannot predict corrections.”
Ed Yardeni on CNBC FM – 1/2 on July 8:
- If the life cycle of a bull market can be divided into four stages—pessimism, skepticism, optimism and euphoria— … I don’t trade this thing on a short-term basis. I do like to look at the trend, and I think we may very well be in the fourth phase,”
Lawrence McMillan was succinct in his Friday commetary:
- “For the first time in a while, some sell signals are beginning to creep into our indicators, and the broad stock market is selling off. So far, the damage has been controlled.
- “So as long as $VIX remains below 13 and $SPX remains above 1925, it’s a short-term correction and not a change to an intermediate-term sell signal“
Jeff Saut of Raymond James on Wednesday, July 9:
- “I have been getting similar readings for a pickup in volatility arriving in mid-July 2014, very much like what we saw in June of 2011. Moreover, the stock market’s internal energy readings are likewise at levels last seen during the summer of 2011. … I am making a “call” for the potential of the first decent pullback of the year to begin in mid-July or early August; and am recommending culling non-performing stocks from portfolios to raise cash. If said decline fails to materialize, we can always recommit the cash to more favorable situations because longer-term I believe this secular bull market has years left to run.”
Peter Bookvar on CNBC Futures Now on Thursday, July 10:
- “I do not” think the market can handle the end of QE, … QE in its current form was a trillion-dollar annualized stimulus program that’s going to zero. It magically turned 1.9 percent GDP growth last year and mid-single-digit earnings growth into a 30-percent-plus gain in the S&P. I think, this year so far, the market’s been OK with it because they’ve been believing that the Fed can somehow make this seamless transition from the QE to a self-sustaining, escape-velocity-type economic recovery. And I think, from what we’ve seen so far in the first half of 2014, that’s not really the case.”
- “I think there’s going to be sort of a bell ringing that, wow, this program is ending, the economy is still growing in fits and starts, and what has lifted asset prices to such an extraordinary extent is now going away. And I thought the market would have learned its lessons after QE1 and QE2 ended, when the markets fell 15 to 20 percent, and think, ‘OK, well we don’t want that to happen again, let’s prepare.’ But I’m afraid that we’re going to rally right into the end, only to tip over again.”
And now we come to Marc Faber who is calling for a 30% decline in the S&P:
- “I think it’s a colossal bubble in all asset prices, and eventually it will burst, and maybe it has begun to burst already, … The problem with crashes, you never know beforehand precisely what is the catalyst, … It could come from the credit market, equities being perceived as too expensive or a geopolitical event, … I think that the global economy does not support the current valuations, … the bond market, which is more sophisticated than the stock market, does not believe in a strong economic recovery ”
5. Brazil – Loser or Winner?
Brazil’s collapse against Germany in the world cup will be remembered for ever by every one who watched it. Brazil’s team may have lost but the Bovespa might be a winner. Why?
- Lawrence McDonald @Convertbond – Brazil $EWZ opens up 2.2% on the heels of the tough loss to Germany; viewed an election negative for socialist Rouseff
Later on Wednesday on CNBC Closing Bell, McDonald put a buy on Brazil:
- “I really like Brazil equities. Technically the 100 day from below is crossing the 200. And Ms. Rousssef is a radical socialist. The loss yesterday in the big game, the soccer game, leads — I think it’s going to hurt her potential re-election chances. if she doesn’t get re-elected in the fall, you are looking at 25% more upside for Brazilian equities.” .
He got company the next day:
- Thursday – J.C. Parets @allstarcharts – NEW POST: Buying Brazil and Selling Germany http://stks.co/a0k9A $EWG $EWZ
Parets makes his case in his Buying Brazil & selling Germany post with two charts:
- “Brazil has gone nowhere in two years while Germany is up over 60%. This next chart shows the ratio of the two ETFs breaking a key downtrend line and now attempting to break out. This looks to me like the beginning of the first higher high to go with the higher low in early June”
- “No one is talking about this shift in money flow out of Europe and into Latin America. On a relative basis, I’m really starting to like this. It also helps keep us more neutral in global equities, which we prefer right now.”
- “Target-wise, I’m looking at that 2.15 level as the first stop. We can go higher than that, but let’s get there first and then reevaluate the situation. This represents about a 35% upside potential with a very fixed, well-defined amount of risk. We like that.”
Parets made his case for this trade and for the S&P seasonality (see section 1 above) on FBN Closing Bell on Friday. He also picked Argentina over Germany in the World Cup final.
6. Gold, Silver & Oil
Remember what Jeff Gundlach said to his investors on Tuesday, June 10:
- “will see higher high in Gold in 2014; which means $1400; $1500 will be best case, might get close to it.”
A break of $1,330 was important to Gundlach, as we recall. A week later, Jeff Kilburg said on CNBC Futures Now:
- “If we get Gold above that 1330 level , shorts will be on the run because there is back & fill all the way to 1390“
Well, Gold broke through $1,330 decisively and closed at $1,339 or $1,340 depending on which quote service you follow. Will we see $1,390 as Kilburg predicted so expansively? Will Jackie DeAngelis, host of CNBC Futures Now, ask Kilburg next week?
George Gero appeared on CNBC Street Signs with a bullish message on Thursday, July 10:
- “I think Silver is playing catch-up. … Silver has actually two horses pulling the cart. you’ve got industrial demand … silver has found a lot of other uses. lcds, computers, medical and so forth. and now, silver also has investment demand, especially in india. … Silver has been lagging. silver was down to $19 and change a few months back. the end of the year. and now it’s up to $21 and change. but silver should be at least half as good as gold.”
Gold has rallied for six straight weeks and the charts look good. But what’s next?
- Raj Dhaliwal @RSDTrading – EOD: Trades: New: Long $GDX Sept 19th $27 & $28 Calls
- Keith McCullough @KeithMcCullough – Gold has had a fantastic week (and year); risk range now $1324-1349
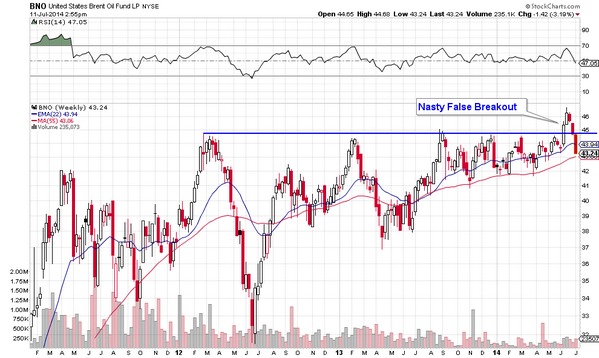
But what about Oil, the loser since Iraq worries subsided?
- Charlie Bilello, CMT @MktOutperform – One of the nastier false breakouts you will see going on here in Brent. $BNO pic.twitter.com/Pr80voIldt
The other view from Market Anthropology in their Sweet Spot article:
- With light sweet crude falling another 2% on the day, the commodity looks quite attractive for those looking to either diversify a portfolio, or capture the next leg higher – that we believe has been foreshadowed by the recent moves in precious metals.
- We expect that similar to the upside pivots in early June in the precious metals sector, oil will also find its footings and surprise to the upside.
- All things considered, the CRB should break higher towards the previous cycle peak as the US dollar index plumbs the bottom of its long-term range
Send your feedback to [email protected] Or @MacroViewpoints on Twitter