Editor’s Note: In this series of articles, we include important or interesting tweets, articles, videoclips with our comments. This is an article that expresses our personal opinions about comments made on Television, Tweeter, and in Print. It is NOT intended to provide any investment advice of any type whatsoever. No one should base any investing decisions or conclusions based on anything written in or inferred from this article. Macro Viewpoints & its affiliates expressly disclaim all liability in respect to actions taken based on any or all of the information in this article. Investing is a serious matter and all investment decisions should only be taken after a detailed discussion with your investment advisor and should be subject to your objectives, suitability requirements and risk tolerance
1. Misnomer no more
Last week, we wrote how the word “Videoclips” in the title of these articles was rapidly becoming a misnomer. This Friday convinced us that Tweeter had finally replaced Fin-TV as the most valuable tool for the investor. That is why we are now retiring the old outmoded term “Videoclips” in favor of the new modern “TACs”. The short acronym stands for Tweets, Articles & Clips.
In the old days, Fin TV was responsible for alerting viewers when something unusual happened in the markets. After all, they were the ones with reporters who knew the players. Not this Friday. This Friday morning, Fin TV anchors were asleep at the wheel while the Twitter-sphere began chattering. Even when alerted by us & others, Fin TV anchors paid no heed. This was real proof that they have become secondary players in news dissemination & opinion distribution.
So we decided to give the pride of place to Tweeter-sphere in our title.
2. The Huge Reversal on Friday morning
The Non Farm Payroll number of 288K stunned virtually everyone. We certainly expected a spike in Treasury yields & vertical fall in Treasury prices. But the worst the TLT did was to fall by 1 point (10-yr yields rose by 9 bps to 2.70%) in the immediate aftermath and SPY rallied by about 3/4 of a point. Then the yields started falling a bit and SPY gave up some of the up move. This choppy action continued until about 10:10-20 am:
- Bespoke @bespokeinvest – 10 year Treasuries selling off hard, up 6.2 basis points; big flattening move of 7 bps in fives versus thirties.
Then watch what happened in the charts below:.
(TLT) (SPY)
(GLD) (SLV)
All four moves were sudden, steep, and on spikes in volume. No one had a clue why they happened. Our guess was either Putin or some large fund was in trouble. Rick Santelli had already pooh-poohed Ukraine effect. But Art Cashin said Ukraine and at the end of the day Steve Grasso & Tim Seymour of CNBC FM also said Ukraine arguing that no one wanted to go short this weekend with Ukraine ahead.
We are nowhere as smart or savvy as these pros but the action smacked of liquidation of positions to us just like the strongly bullish flattening action in bonds on Thursday afternoon. That action was so weird ahead of a consensus strong number, so weird that David Rosenberg tweeted on Thursday afternoon:
- Gluskin Sheff @GluskinSheffInc – David Rosenberg: Bonds seem to have a different forecast than consensus on tomorrow’s number. #BondMarket
Well, David Rosenberg was wrong for once because the consensus was correct. A better comment about Thursday’s flattening came from (via retweet by @kathylienfx):
- michael mackenzie @michaellachlan – 30yr Treasury yield hits lowest level since June – 3.43%. Big positioning shifts driving activity as curve steepeners being liquidated
If Thursday was liquidation, then Friday’s spike was absolutely liquidation and a bigger one. The 10-year yield fell by 2 bps on the day after being up 9 bps after the payroll report with a peak-trough move from 2.70% to 2.57%. And the 30-5 yr spread closed at 170 bps.
Jim Bianco essentially argued for short covering in his conversation with Rick Santelli on Friday morning:
- “look at surveys of money managers, I’m not exaggerating saying 100% short the market. everybody’s short the bond market. everybody’s demanding rates go up but they’ve alread
y sold. the sell trade is already occurred and that’s why you can’t get any kind of movement down in price or up in yields in price in bonds right now. There’s no one left to sell.”
As if on challenge, Tim Seymour of CNBC FM said on the Friday 5 pm show that he had bought the TBT. But have the shorts been wrung out? If not, where are their stops? Art Cashin said that he would be worried if the 10-year yield fell through 2.50%.
But Bill Gross now thinks the 10-year yield is at a fair level:
- PIMCO @PIMCO 10m – Gross: Huge 1 day reversal in bonds. 2.60% seems about right for 10 yr Treas. given low inflation.
3. “Fed’s Offsides”
was the call made by Rick Santelli on Friday morning. In football, a foul is called on the player who is offsides. In Fedland, the investors take the penalty when the FOMC chairman is offsides. After all, the most flagrant offsides call of our times has to be on Ben Bernanke for his comments on Wednesday May 22, 2013. The Q1 2014 GDP print of 0.1% should be enough by itself to show how unnecessary that was.
Another key evidence was pointed out on Thursday afternoon:
- Michael A. Gayed,CFA @pensionpartners – Ultrashort long duration Treasury ETF $TBT now BELOW May when taper talk began #risingrateenvironment
He is absolutely correct. On Tuesday May 21, TBT closed at $64.41. It went into its own bull market to close 2013 at $79.26. On Friday TBT closed at $62.38 – more than 100% reversal of what Bernanke’s hawkish prod to markets. At Gayed’s suggestion, we calculated the movement of TLT by including dividends & found that today’s effective price of TLT is $116.09 just about 1% below the May 21, 2013 close of $117.79. A complete reversal of the entire move that was caused unilaterally by Bernanke pretending he knew how to speak to the markets. See section 5 below for Helene Meisler’s equity market evidence of the reversal of Bernanke’s taper tantrum.
We also looked up our own favorite indicator, the one that Rick Santelli taught us back in the pre-QE4Ever days. In those days, the 30-10 yield had big resistance at 100 bps and whenever the spread rose above 100 bps, buying the 30-year bond made money. In fact, Rick Santelli had said on CNBC (as we recall), there were only 3 times he had seen that spread exceed 100 bps in his career. Well, the QE4Ever converted the 100 bps level into support from resistance.
After spending months above the 100 bps level, the 30-10 year yield spread once again fell through the 100 bps support on Thursday, December 19, 2013. It has never looked back. On Friday it closed at 78 bps. Did something happen on Wednesday, December 18, 2013? The Fed did its first taper of $10 billion on that day.
The 100 bps level regained its status as a superb indicator as soon as the Fed signaled its decision to end the taper. What a buying opportunity it provided on December 19, 2013? The 30-year yield was at 3.905%; TLT was at 102.67 and EDV, the zero-cpn ETF, was at 91.32. On Friday, these closed at 3.37%, 112.77 and 104.51 resp.
But what about the other bound? Our empirical observation is that a major bond rally ends when the 30-10 year yield spread touches 50 bps. So Friday’s close of 78 bps is right smack in the middle of the 100 bps resistance and 50 bps support in a non-QE environment.
A “big point” was made by Rick Rieder on BTV Market Makers on Friday:
- “ultimately what is going to happen & this is a big point – the Fed is going to make it clear that the long run Funds rate is lower than it has been historically; what that means is that the yield curve can stay relatively flat; long rates don’t move much – that to me is where we are going”
But have we come too far too fast in long Treasuries?
- J.C.Parets @allstarcharts Here’s bear case for treasury bonds. As bullish as I am & have been, I try to argue both sides $TLT stks.co/i0ZIK

While European credit is still flying high with yields in Spain falling through 3%, U.S. credit is showing signs of strain. J.C. Parets has been warning of high yield bonds falling relative to Treasuries for some time. On Friday he used the “breaking down” term for high yield credit.
- COTD: Here’s the bond market breaking down, warning of stock market to follow $HYG vs $TLT and $SPY stks.co/p0HcZ

- Ben Eisen @BenEisen – Should investors be worrying about leveraged loans? Recent outflows are putting some on edge: on.mktw.net/1uf6fPv pic.twitter.com/3T9J27YNLg.
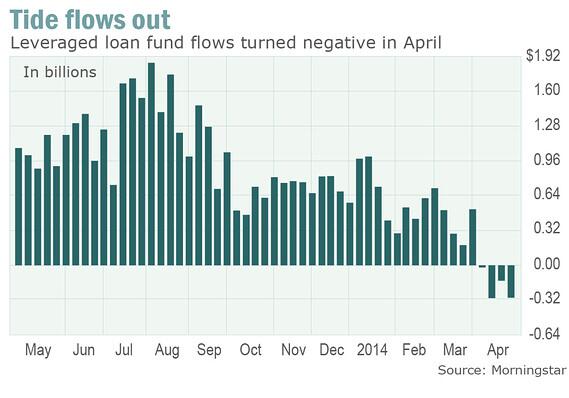
Not all leveraged U.S. credit is weakening. Muni Closed End Funds are still acting very well. See ytd charts below of 3 NY Muni CLOs – MHN (BlackRock), NNP (Nuveen) & PNF (Pimco). All three distribute dividends at 6% after all taxes and the the first two trade at 5.6% & 8.2% discounts to NAV.


5. U.S. Equities
Is this choppy action leading to a correction in the stock market or is it still a rotation? A correction does not end until everything goes down and the S&P still refuses to do so. In fact, the S&P action looks bullish to Lawrence McMillan who wrote on Friday:
- “The stock market is stalled at the high end of its trading range (1810-1900). There is near-term support at last Monday’s low of 1850. In summary, market is on the verge of turning bullish here, but a breakout over 1900 by $SPX is going to be required to confirm it“
The rotation case was made on Friday by:
- Robert Hum @HumOnTheMarkets – $COMP set to outperform $SPX on a weekly basis for 1st time in 2.5 months. Last 10 wks: $COMP -3.2%, $SPX +2.5%
and graphically on Thursday by:
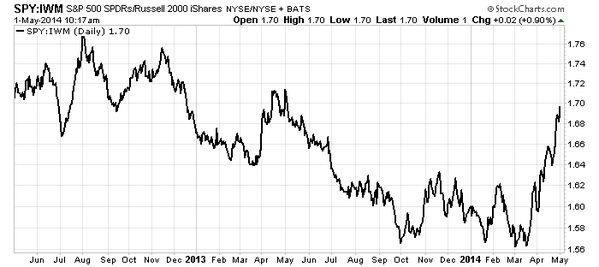
- Helene Meisler @hmeisler – $SPY:$IWM ratio almost back to peak from Taper Tantrum. pic.twitter.com/6fYBJuQtXc
A similar case of S&P mega-caps outperforming S&P was made on Thursday with the ratio of equal weighted S&P to standard of cap-weighted S&P:
- Downtown Josh Brown @ReformedBroker – via Stephen Suttmeier at BAML – mega-caps take control vs S&P for the first time since the rally began pic.twitter.com/7vZ6qSj4G5

The rotation case was also made on Wednesday in:
- Mark Newton @MarkNewtonCMT – Demark indicators on RELATIVE charts of sectors vs SPX suggest that FINS, INDU & TECH could strengthen, while Utes, Staples peak in 2-3 wks
The absolute determinant is whether deeply oversold stuff bounces. Remember deep oversold conditions did not lead to a bounce in 2008 and high yield credit kept selling off against Treasuries in 2008. So are we in an 2008-like environment? Tom McClellan asks and tries to answer in his article Discretionary vs. Staples. This article looks at performance of XLY vs. XLP as a ratio:
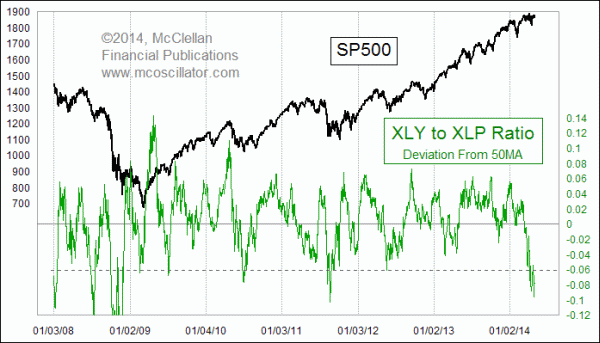
McClellan writes:
- “Just recently, that spread has dropped to a deeply negative level, which is usually a sign of a bottom for the overall stock market. The message is that the bearishness causing investors to flee the consumer discretionary stocks may have gotten overdone.”
- “It is worth noting that an oversold reading for this indicator did not halt the stock market’s decline in 2008, a time when the Fed was actually shrinking its holdings of Treasuries in the face of the worst liquidity crisis in a generation. That is not the background condition we have now, with the Fed still inflating its Treasury and MBS holdings through “quantitative easing”, and so unless one is willing to make the bet that the stock market now is somehow in another version of the 2008 bear market, it is much more likely that this oversold condition should get some traction.”
The ratio of HYG to TLT discussed by J.C. Parets in section 4 above is sort an equivalent of this XLY to XLP ratio because high yield bonds and discretionary stocks tend to need a growing economy to outperform. Looking at credit, J.C. Parets seems negative while Tom McClellan seems positive as he looks at equities.
The correction side was hinted at in:
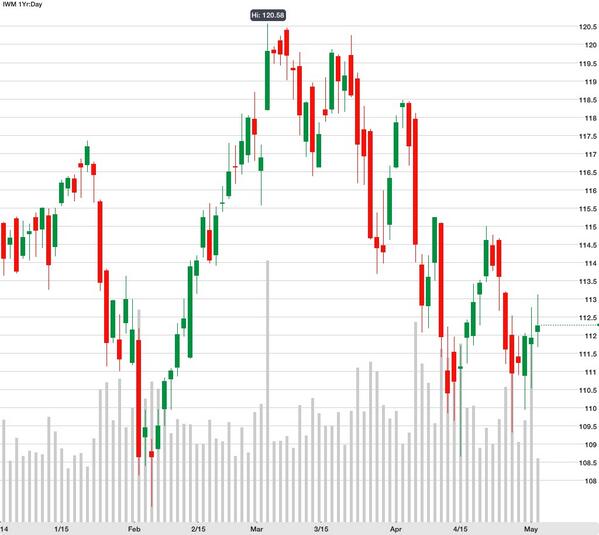
- Jeff Chmielewski @JeffCNYC – I’m no chart voodoo expert, but $IWM seems to be making a series of lower highs. Kind of like heroin. pic.twitter.com/2fmcBP6R60
Seasonality
We are in the “Sell in May & Go Away” month, aren’t we? The empirical case was made on CNBC FM 1/2 by J.C. O’Hara on Monday:
- We’ve actually found, on average, over the last 20 years that the sell-in-May, the May through September bucket, was basically responsible for 0 percent of the S&P 500’s returns. And I think that is very, very interesting, especially as we are right now. We’re basically flat on the year.
- Although the S&P 500 in May was up 65 percent of the time over the past 20 years, O’Hara argued that all of the index’s significant gains came October through April
A pictorial case was made on Friday afternoon in:
- Urban Carmel @ukarlewitz – SPX past 10 years: May-July highlighted. Risk/reward negative when May starts near a relative high. pic.twitter.com/NfFBz0rnvd
6. Materials – Copper & Gold
The really weird action on Friday was in basic materials with Freeport McMoran (FCX) up 1.5% and CLF up 3.5% accompanied by Brazil up 3.5%. The difference is that FCX & CLF rallied right from the open unlike Gold that spiked around 10:30 am. This action was impressive:
- J.C. Parets @allstarcharts – I was impressed with Copper last week and I’m impressed with it this week. It’s still a hot mess, but looking better, I must admit $HG_F
The spike in Gold led to a difference in opinion:
- Mark Newton @MarkNewtonCMT – Precious metals have reversed early losses, now Gold up 17, back up above 1300, w/ Silver up 2.5%, & holding $19 on weekly close positive
- Brian Stutland @BrianStutland – CNBCFuturesNow trimmed gold exposure even though didn’t quite hit $1306 price target. Now 92% stocks, 8% cash in our macro trade model.
A technical view came in:
- Kristian Kerr @KKerrFX – Gold retest held abv last wk’s key cyclical low (61.8% time extn June/Dec 2013 lows). Promising bottoming process pic.twitter.com/ATMJM3EXDx

Send your feedback to [email protected] Or @MacroViewpoints on Twitter